EXPLAIN PLAN Analysis
Learn how to analyze query execution plans by DBMS to assess performance.
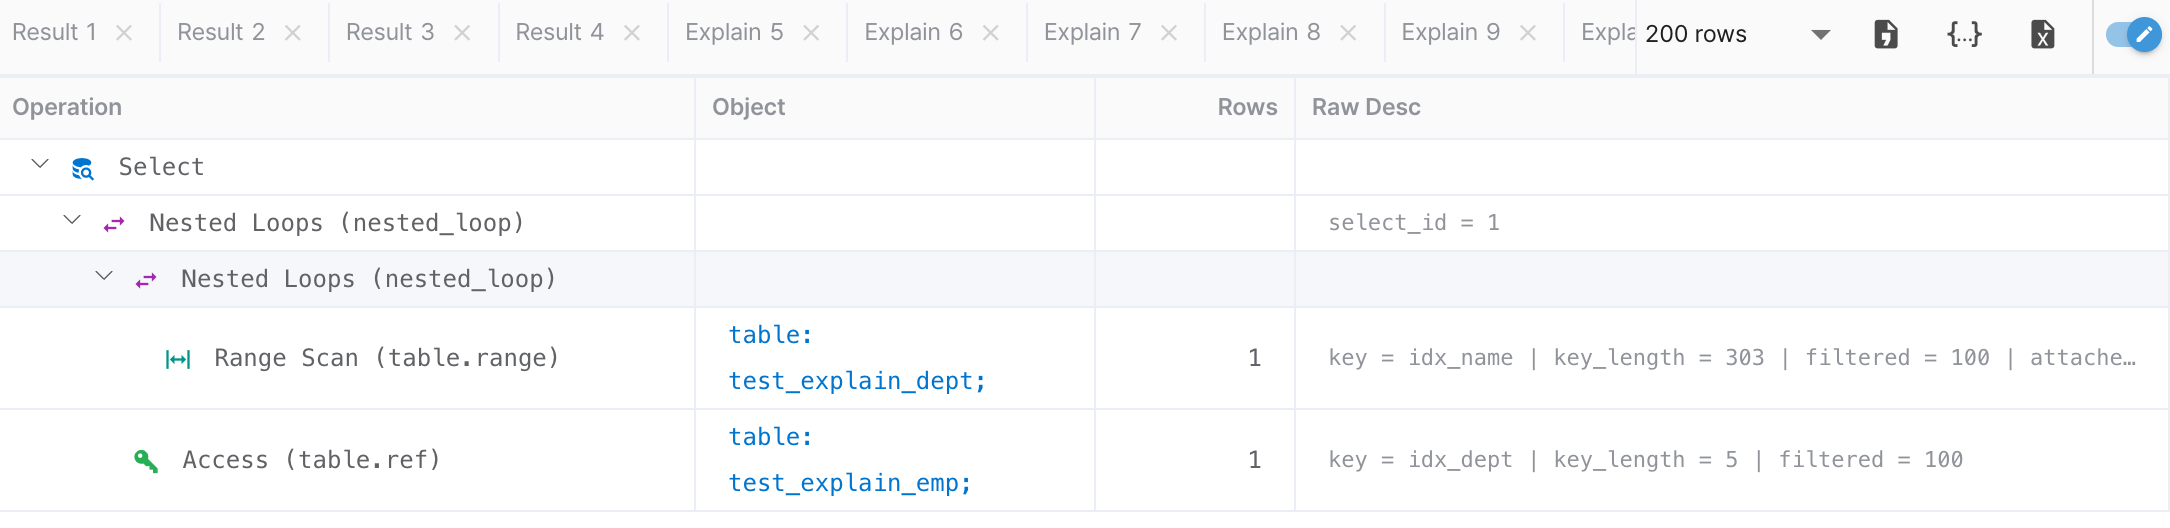
Click the PLAN button in the Toolbar to view the execution plan for the SQL statement at the cursor position. Results are displayed in tree format in the Explain tab.
Reading the Execution Plan Tree
Each node shows Operation, Object, Rows (estimated row count), and detailed description. Node types are distinguished by colored icons:
| Color | Operation Type | Performance Impact |
|---|---|---|
| Full Scan, Sequential Scan | Full Scan, Sequential Scan | Caution needed — scans the entire table. Consider adding an index. |
| Index Scan, Index Range Scan | Index Scan, Index Range Scan | Good — utilizing an index. |
| Key Lookup, Const, System | Key Lookup, Const, System | Optimal — constant time or key-based access. |
| Nested Loop, Hash Join, Merge Join | Nested Loop, Hash Join, Merge Join | Join operation. Performance varies by join method. |
| Sort, Group, Materialize | Sort, Group, Materialize | Sort/group operation. May use temporary space. |
MySQL / MariaDB
Uses the EXPLAIN statement to view execution plans.
Key items to check:
- type — Access method (ALL, index, range, ref, eq_ref, const, etc.). ALL means a full table scan.
- key — Index name used. NULL means no index was used.
- rows — Estimated rows to scan. Higher values require more attention.
- Extra — Additional info (Using index, Using filesort, Using temporary, etc.)
PostgreSQL
Uses EXPLAIN ANALYZE to view execution plans with actual execution statistics.
Key items to check:
- Seq Scan — Sequential scan. Reads the entire table.
- Index Scan / Index Only Scan — Scans using an index.
- Nested Loop / Hash Join / Merge Join — Join methods. The optimal method depends on data size.
- cost — Estimated cost (startup cost .. total cost). Compare as relative values.
- actual time — Actual execution time (when using ANALYZE)
EXPLAIN ANALYZE actually executes the query. Be cautious with DML statements as data may be modified.
Oracle
Generates an execution plan with EXPLAIN PLAN FOR and retrieves results with DBMS_XPLAN.DISPLAY.
Key items to check:
- TABLE ACCESS FULL — Full table scan
- INDEX RANGE SCAN / INDEX UNIQUE SCAN — Index scan
- NESTED LOOPS / HASH JOIN / SORT MERGE JOIN — Join methods
- Cost — Estimated cost by the optimizer
- Cardinality — Estimated return row count
SQL Server
Uses SET SHOWPLAN_TEXT ON to view text-based execution plans.
Key items to check:
- Table Scan / Clustered Index Scan — Full scan
- Index Seek / Clustered Index Seek — Index seek
- Nested Loops / Hash Match / Merge Join — Join operations
- EstimateRows — Estimated row count
SQLite / H2
SQLite uses EXPLAIN QUERY PLAN, and H2 uses EXPLAIN.
SQLite EXPLAIN QUERY PLAN key items:
- SCAN TABLE — Full table scan
- SEARCH TABLE ... USING INDEX — Search using an index
- USING COVERING INDEX — Covering index (returns results from index only, without table access)
H2 returns execution plans in tree format, showing table scan methods and index usage.